The MECH 206 Dynamics course research project was a project assigned to groups consisting of 3 people. We were GROUP 2 and we were assigned to perform dynamics analysis of a six bar linkage bolt insertion mechanism. We first inspected the video to understand the movement of the mechanism and determined the dimensions of the system by using video recording.Then we used Siemens NX 11 to design our CAD model. Later on we manufactured the parts using laser cutting and assembled the parts at the mechanics shop. We also used NEMA 17 Step motor controlled by Arduino UNO microcontroller and Pololu A4988 step motor driver. We used MATLAB to simulate the mechanism using the theoretical values and formulas derived by us. After the theoretical simulation, we compared the results with the experimental data we acquired by using video point tracking. Since the theoretical data and experimental data showed correlation with minor errors and the mechanism was moving according to the source video, the project was concluded.
Meet Our Team
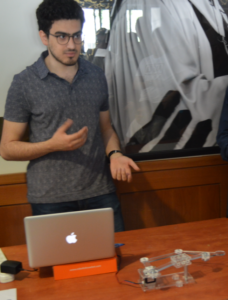

BORA ASIK
AYBEK KAYRA GURAL
YIGIT TUMSEN
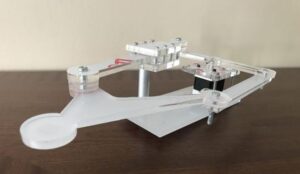
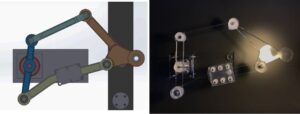
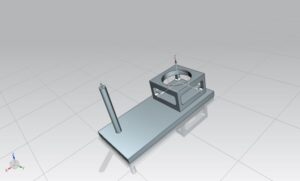
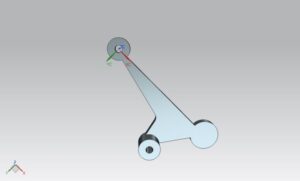
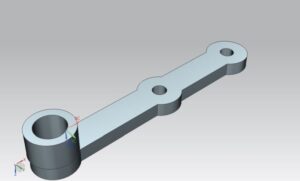
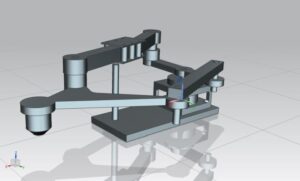
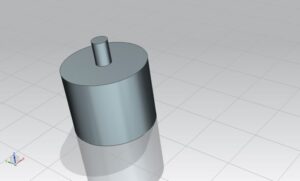
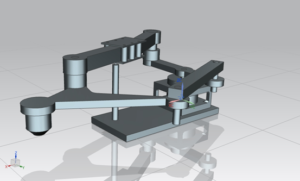
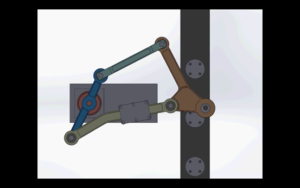
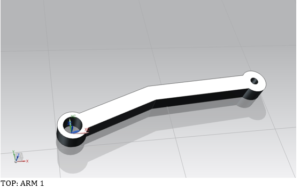
The mechanism consists of four bars (ARM1,ARM2,ARM3,ARM4), a slider, a base and a motor. The motor rotates the ARM 4; this rotation causes other arms to move since the other arms are also connected to ARM 4 via linkages. There are two limitations in the mechanism that reduces the degrees of freedom. First one is the linkage between the motor rod and the ARM 4, which avoids ARM 4 from translating into other positions and limits the movement of ARM 4 only to rotation about the motor rod axis. Second limitation is the slider, which is connected to the base by a rod that also provides the required clearance between the arms to avoid any collisions within the mechanism that could result in malfunctioning.
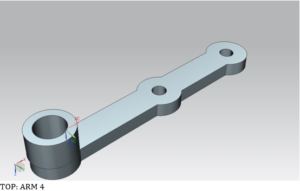
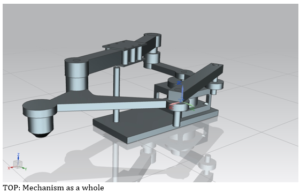
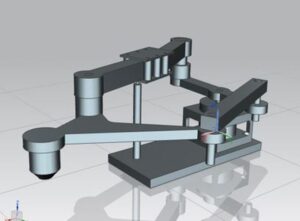
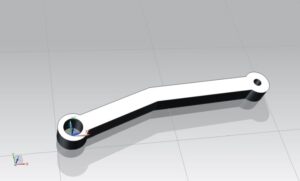
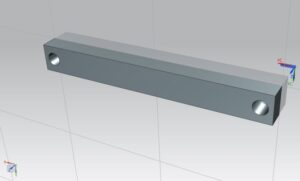
Later on we continued with the design process in computer environment. We used Siemens NX 11 (a CAD – Computer Aided Design program) to design the parts. For convenience we made several changes in the design of the mechanism for the sake of simplicity. However we had to make more changes during the manufacturing process of the parts, which we will be mentioning, in the manufacturing process.
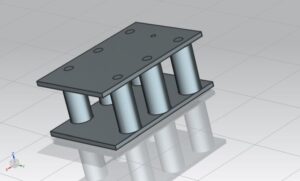
We completed the design of each different part and then made the assembly in Siemens NX. Later on we encountered our first problems regarding with the alignment of the bars and the slider. Our tolerances were not enough for the slider and we had collapsing rods. In order to solve the problem of slider, we have drawn the component again with bigger tolerances. Moreover, we had to find spacers to add height between rods, but we wanted to design our own spacers instead of going somewhere else and finding for a precise one. We have drawn cylinders for that and we were ready to start the manufacturing process since we observed that the movement of our design is (theoretically) working according to the example after making these changes.
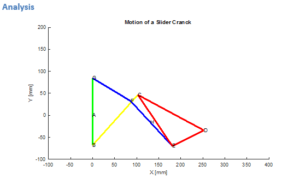
In order to have the experimental data, we used MATLAB color tracking code. The color tracking function of MATLAB, opens the video of the system’s movement which is captured before hand, and then tracks the pixels of that video with the specific color values with a minor margin for each color value (R,G,B). While capturing the system we glued different colored tapes on top of each joint in order to track each them precisely even though we couldn’t manage to track some of the points which are not necessarily important for the comparison between the theoretical data and the experimental data.
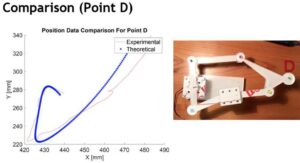
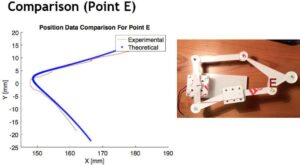
Here below are the two different comparisons of two different points position.
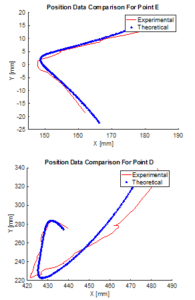
According to these graphs, we can easily say that our mechanism shows great correlation with the simulation data. By the way, the reason why the position of Point E has less error compared to the position of Point D is because as we come to the right hand of the mechanism the theoretical position vectors become more complicated, therefore the mechanism in real life becomes more prone to any jerk or error caused by imperfections during the manufacturing process. However the data still shows great correlation to each other with less than 10% error.